
When a client shows us their dashboard and asks "are these numbers any good?", the honest answer is almost always: it depends on what you sell, who you sell it to, and how competitive your space is. But that's not a useful answer. Let's look at what the numbers actually say.
In this article you'll see the real benchmarks from the most credible public sources in the industry (WordStream, Triple Whale, WebFX), what they mean, and some observations from our own Greek-market campaigns — where the local market diverges from international numbers.
Important: benchmarks are reference points, not targets. If your numbers are below average, it could mean you're doing something wrong — or something much better. Always look at the context.
Google Ads: search campaigns
Average CPC
The most recent benchmark we can rely on is the annual report from WordStream / LocaliQ, which analyzed 16,446 active search campaigns covering April 2024 – March 2025. According to it, the average CPC across all industries reached $5.26 — an increase that appeared in 87% of industries, for the fifth consecutive year.
If that sounds high, there's a reason. The number is US-centric and is dragged up by industries like insurance and legal services where CPC exceeds $8.
The per-industry breakdown is more useful. Based on the same WordStream data:
| Industry | Average CPC (USD) |
|---|---|
| Arts & Entertainment | $1.60 |
| Restaurants & Food | $2.05 |
| Travel | $2.12 |
| Education & Instruction | $6.23 |
| Home & Home Improvement | $7.85 |
| Dentists & Dental Services | $7.85 |
| Attorneys & Legal Services | $8.58 |
Source: WordStream 2025 Google Ads Benchmarks.
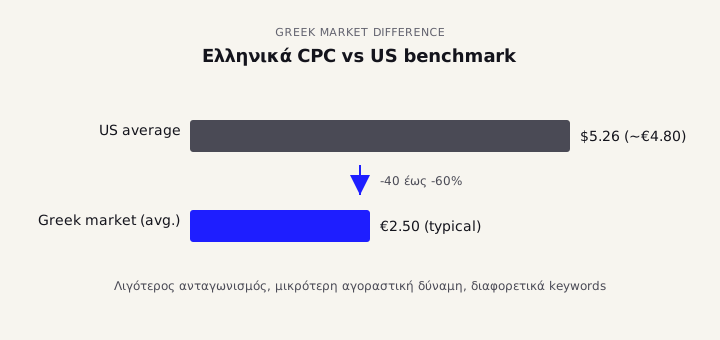
What we see in the Greek market: Greek CPCs run consistently 40-60% lower than US for the same industries. Less competition, smaller spending power, different keyword mix. So a Greek e-shop in fashion typically pays €0.30-0.80 per click on non-branded terms, not the WordStream flagship numbers.
If you want to figure out what acquiring a customer actually costs you, take a look at our CAC & LTV calculator.
Conversion rate
Here comes the most misunderstood number. WordStream reports a 7.52% average conversion rate for search ads in 2025 — and the typical Greek e-shop owner doesn't recognize themselves in that number.
Why? 7.52% is an all-industry average that includes lead generation and B2B where "conversion" means form fill, not purchase. For e-commerce with normal pricing, the real numbers are clearly lower.
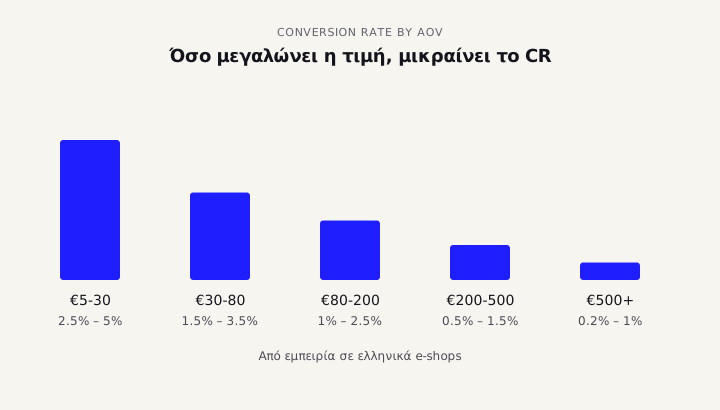
From our experience with Greek e-shops with reliable tracking, steady traffic and campaigns that have been running long enough:
| Product price | Realistic conversion rate |
|---|---|
| €5-30 | 2.5% – 5% |
| €30-80 | 1.5% – 3.5% |
| €80-200 | 1% – 2.5% |
| €200-500 | 0.5% – 1.5% |
| €500+ | 0.2% – 1% |
Practical rule: the higher the AOV, the lower the conversion rate. If you sell something at €600 and have a 4% conversion rate, you're either a rockstar or your data is wrong. Investigate.
Target ROAS
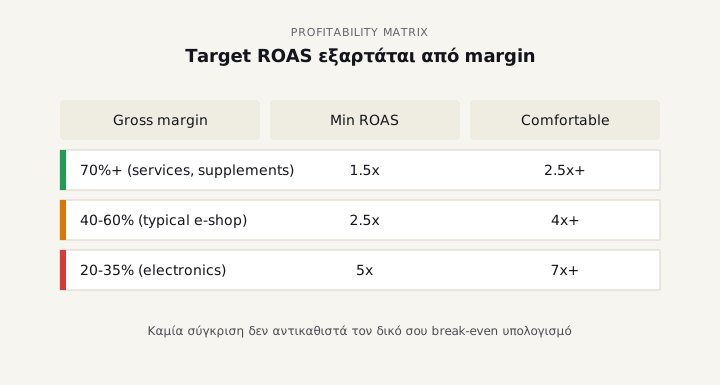
The ROAS you need to be profitable depends on your gross margin, not on some industry average:
| Gross margin | Min profitable ROAS | Comfortable ROAS |
|---|---|---|
| 70%+ (cosmetics, supplements, services) | 1.5x | 2.5x+ |
| 40-60% (typical e-shop) | 2.5x | 4x+ |
| 20-35% (electronics, certain retail) | 5x | 7x+ |
If you don't know your gross margin precisely, stop fiddling with ads and go calculate it first. It's the most important number.
 Try our ROAS calculator to see how break-even ROAS shifts when margin changes.
Meta Ads: Facebook + Instagram
CPM (cost per 1,000 impressions)
The most recent dataset for Meta comes from Triple Whale, which analyzed nearly 35,000 brands across 2025. The median CPM by industry reached $13.48 — with every single industry showing YoY increases, averaging +20.03%.
Specifically:
| Industry | Median CPM (USD) |
|---|---|
| Health & Wellness | $20.70 |
| Lifestyle & Boutique | $14.12 |
| Fashion | $13.90 |
| Electronics | $14.50 |
| Books & Music | $12.80 |
Source: Triple Whale Facebook Ads Benchmarks.
Important for Greek campaigns: Meta CPMs in Greece run consistently 50-65% lower than US — typically €4-9 for cold prospecting in Europe/Greece versus the $13+ Triple Whale reports for US.
Also, Meta CPMs spike 25-66% in November-December (Madgicx 2025 e-commerce report). If you start campaigns on November 15th, you'll pay nearly 2x what you would have paid starting September 1st. This is Greek Market Problem #1: everyone wakes up around the holidays.
CTR
From WordStream + Triple Whale data:
- Awareness video ads: 0.8% – 2%
- Carousel ads: 1.2% – 2.5%
- Static image (cold): 0.9% – 1.8%
- Static image (retargeting): 1.8% – 3.5%
- Catalog ads (DPA): 1.5% – 3%
If your CTR is below 0.7% on cold audiences, your creative has a problem. Not the targeting.
Conversion rate on Meta
Meta traffic always has lower conversion rates than Google. Makes sense: on Google people search, on Meta they scroll. According to WebFX 2026 Meta Marketing Benchmarks, the average Facebook ROAS reaches 2.79, while the e-commerce median is around 2.19x.
From us:
| Audience type | Realistic conversion rate |
|---|---|
| Strong interest match / Lookalikes | 1.2% – 2.8% |
| Generic interest match (cold broad) | 0.5% – 1.3% |
How to use benchmarks correctly
First: compare them to yours ONLY if you have statistically reliable data. At least 100 conversions for conversion rate, at least €1,000 spend for CPC averages. Below that, the data is noise, not signal.
Second: look at the difference, not the absolute number. If your CPC is €0.55 in fashion and the Greek average is €0.30-0.80, you're in the zone. If your ROAS is 2x in supplements (gross margin 70%+) and you need 1.5x minimum to be profitable, you're profitable.
Third: benchmarks change. The numbers in this article come from Q4 2024 – Q1 2026 reports. In 12 months they'll be different. If you're reading this in December 2026, look up newer data first.
When your numbers are "wrong"
If any of these is happening, there's likely a problem:
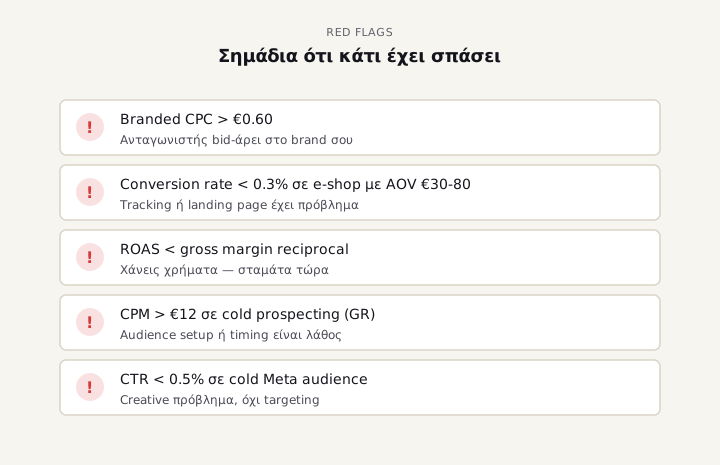
- Branded CPC > €0.60. A competitor is bidding on your brand. If they're violating trademark, file a complaint; otherwise outbid them.
- Conversion rate < 0.3% on an e-shop with AOV €30-80. Your landing page or tracking has issues. (If you haven't checked your GA4 events recently, book an audit — that's one of the first things we look at.)
- ROAS < gross margin reciprocal. You're losing money. Stop.
- CPM > €12 on cold prospecting in Greece. Audience setup is wrong, or you're running in the wrong season.
- CTR < 0.5% on cold Meta audiences. Creative problem — not targeting.
Conclusion
Numbers alone tell you nothing. We've seen a client running ROAS 2.1x in supplements make decent money (78% gross margin) — and another with ROAS 4.5x in electronics lose money (18% gross margin).
The right question isn't "are my numbers good?". It's "am I making money from this?". And to answer it you need:
- Clean gross margin per product/category
- Correct attribution (do Google Ads conversions match your Shopify/WooCommerce orders?)
- Long-term data — not 7-day snapshots
- Context for the season (Black Friday vs February)
If you want us to look at your numbers with this framework, book a free audit. 30 minutes call, we tell you what we see in your account, no obligation.
Wondering what management itself should cost on top of your media spend? See how much Google Ads management costs in Greece in 2026 — realistic ranges by account size.
Sources
- WordStream 2025 Google Ads Benchmarks — 16,446 search campaigns, April 2024 – March 2025
- Triple Whale 2025 Meta Ads Benchmarks — ~35,000 brands, full year 2025
- WebFX Meta Marketing Benchmarks 2026
- Madgicx Meta Ads Benchmarks 2025
- WordStream Facebook Ads Benchmarks 2025